2022 Transportation Engineering
In order to meet the traffic demand and improve the effective of the traffic signal control under uncertain condition, this paper initially proposed a new signal timing interval optimization model of traffic signal control based on the interval optimization theory. Firstly, the traffic flow interval in rush hour was determined by 5 min acquisition section and used as the input parameters of traffic control system. Secondly, the interval-valued nonlinear optimization model of signal timing was constructed by taking the average vehicle control delay interval as the objective function.Thirdly, taking the intersection service level as the performance objective, this model was transformed by using the interval possibility degree model and solved by using genetic algorithm. Finally, the three-phase and two-phase intersections in rush hour in Beijing were simulated by using VISSIM simulation software. The results show that the method is feasible and effective, and is obviously superior to Webster scheme, robust optimization method and measured data at three-phase intersection with large fluctuation of traffic flow. The vehicle average delay decreases by 26.57% and capacity increases 7.07% compared with the measured data. At the two-phase intersections with relatively stable traffic volume, the interval optimization method is feasible and can achieve the expected control effect, but it is weaker than other schemes. Furthermore, the signal timing interval optimization model was used by the eight intersections in rush hour in Beijing with VISSIM simulation software and analyzed by the fluctuation trend of the saturation and the average delay of the 5 min acquisition section.The analysis show that the interval optimization model can achieve the expected control effect for each intersection during peak hours, and is more suitable for intersections with large traffic flow fluctuations, and the performance of the control scheme is more stable.
In the background of rail transit network operation, the simple line and routing forms can no longer meet the diverse passenger travel demand. Therefore, in order to cope with the mismatch between traffic supply and demand brought about by passenger trips in complex directions, the paper proposed a rail transit line form of general Tree-type line based on the existing research on Y-type lines, and it was divided into diameter type and radius type with reference to the actual operating line cases. Firstly, the paper designed a line topology form of Tree-type line and established a multi-routing planning optimization model for Tree-type line by considering the distribution of passengers among different trains and taking the departure frequency as the decision variable and the passenger travel time and minimum operating cost as the target function. Then it designed and solved the non-dominant ranking genetic algorithm (NSGA-Ⅱ) with the elite strategy. The model and algorithm were validated using the RER A line in Paris as an example. Finally, the optimization scheme was compared with the split-line scheme. The results show that: the algorithm can find the Pareto frontier solutions of the train planning, and the travel time of passengers and the operation cost of enterprises show a significant negative correlation; the obtained optimization scheme has a significant reduction in the travel time of passengers and the operation cost of enterprises compared with the split-line scheme. It reduces the waiting time of passengers by 1.76% to 12.90%, the transfer time of passengers by 33.63% to 34.98%, the total running kilometres of trains by 7.69% to 21.67%, and the the number of trains on the line by 9 to 19.
Private car commuters were divided into two groups: group I who feel anxious about road congestion and group II who are more concerned about whether they can arrive punctually. The trip sensitivity coefficient (congestion anxiety coefficient, punctual anxiety coefficient) and the bottleneck tolerance coefficient were introduced to characterize the travel anxiety level of the two types of commuters. A new trip cost function was developed based on the standard bottleneck model and was applied to analyze indicators such as departure-rate, peak-start-end time and commuter-composition in single and shared routes. The results show that when there is only a certain type of commuters on the road, the increase of the congestion anxiety coefficient, bottleneck tolerance coefficient and punctual anxiety coefficient will reduce the total perceived travel cost of the system for commuters on a single line. The number of group II increases, the total perceived travel cost of system decreases, and the peak period shifts forward as the punctual anxiety coefficient of group II in mixed situation 1 rises; the total perceived travel cost of system falls as the bottleneck tolerance coefficient increases, while the peak period moves back. In the mixed situation 2, the congestion anxiety coefficient and the bottleneck tolerance coefficient of group I have dual effects on the number of this group, and under the combinations of different bottleneck tolerance coefficient and congestion anxiety coefficient, the attractiveness of this group exhibits three different trends: monotonically decreasing, first decreasing and then increasing, and monotonically increasing.
To improve the anti-cracking performance of the negative bending moment zone of the continuous prefabricated beam bridge, this paper proposed a UHPC-NC (normal concrete) structure with a high reinforcement ratio (larger than 1.5%) in the negative bending moment zone of an assembly continuous beam bridge. Taking A PC continuous beam bridge on the Nanchang to Jiujiang expressway as the engineering prototype, the study carried out the scale model tests with the scale ratio of 1∶4 in the transverse direction and 1∶5 in the longitudinal direction. Then, based on the "plane section" assumption, it developed the calculation methods formula of the cracking moment for the connection structure under different bearing modes. The influences of the thickness of the UHPC layer and reinforcement ratio on the cracking moment were analyzed by means of the finite element method. The results show that the cracking moment with the UHPC layer in the negative moment zone of the continuous girder bridge is improved significantly. The feasibility of the connection structure and the validity of the finite element model were verified and the calculation method of cracking moment in this paper is reliable and can provide reference for design and engineering application. the relative error of the reinforcement ratio between the finite element method and the method in this paper is within 10%. Under the action of pure moment and bending shear combination, the cracking moment of UHPC-NC structure increases with the increase of UHPC layer thickness and reinforcement ratio.
In order to accurately identify the propagation path of recurrent congestion and analyze its propagation mechanism to alleviate the traffic congestion at the source and block the propagation path, this study proposed a method of analyzing the congestion propagation mechanism based on taxi GPS data. Firstly, the number of vehicle trajectories and travel speed were used to identify the traffic congestion area based on the space-time cube model of urban road network. According to the relative spatio-temporal stability of recurrent congestion, a time-section recognition method of recurrent traffic congestion grid was proposed. Secondly, the spatio-temporal congestion propagation trees was constructed. Aiming at the dynamics of traffic congestion propagation, a method of mining frequency-weighted recurrent propagation relation set was proposed to construct recurrent congestion propagation subtrees. Thirdly, the Dynamic Bayesian Network was introduced to obtain the congestion propagation probability through Bayesian estimation. Finally, taking the eastern section of the South Second Ring Road in Xi'an as an example, the proposed method was used to conduct an empirical analysis to explore the congestion propagation path and its probability. The research results show that based on the space-time cube model, the recurrent congestion grids in each time frame identified by the number of vehicle trajectories and travel speed lay the foundation for the accurate analysis of the congestion propagation mechanism. The congestion propagation trees constructed by using the STC algorithm, and the proposed frequent itemsets mining method considering temporal reproducibility characteristics of congestion propagation can be used to reconstruct the recurrent congestion propagation subtrees and clarify the propagation path of recurrent congestion. The possibility of congestion propagation between grids was analyzed based on the Dynamic Bayesian Network. It provides a theoretical basis for dynamically finding the key segment in the congestion propagation network, scientifically and reasonably formulating the congestion alleviation scheme and the task timeline.
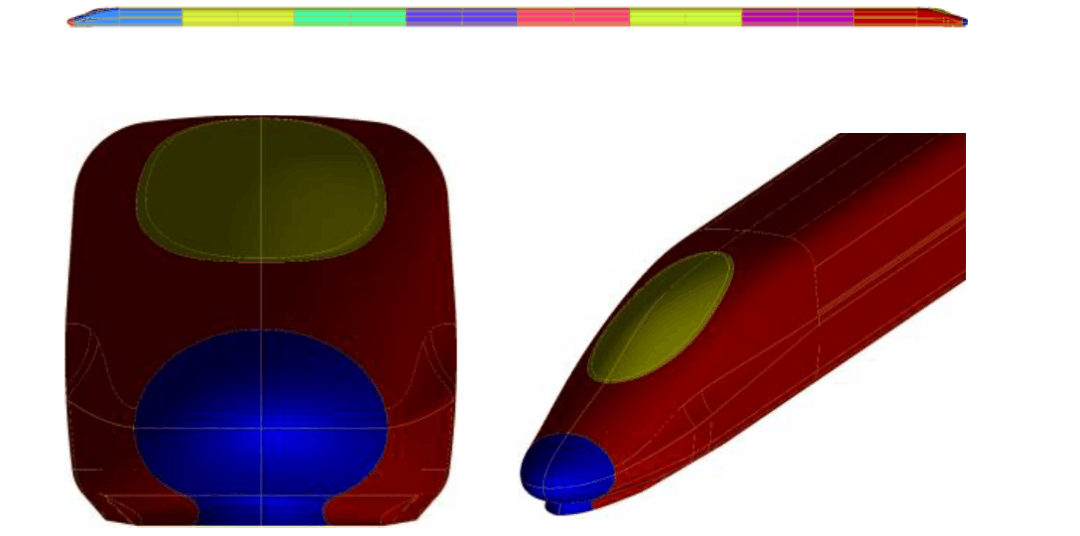
Partial air cushion support catamaran (PACSCAT) is a new type of high-performance ship based on slender catamaran and supplemented by partial air-cushion support. Its bottom is flat and wide, and the air-cushion displacement volume accounts for about 30% of the whole ship. Due to the air cushion, the ship will have many nonlinear characteristics when sailing in the waves, influencing the motion performance of the hull heavily. The three-dimensional potential flow theory considers the three-dimensional effect of the flow field and it has been widely used in the field of ship hydrodynamics, so it can be effectively applied to the study of strong nonlinear motion characteristics of ships, which coincides with the study of nonlinear mechanics of hovercraft. The research was based on the rigid air seal form of the cushion system, and took into account the nonlinear characteristics of the air cushion. Therefore, in order to verify the form of numerical calculation method of PACSCAT with rigid seals, and study its movement characteristics in waves, this paper adopted the free surface method, and used overlapping grids and slip grids to analyze its performance in clam water. Furthermore, based on the best grid form, its navigation performance in regular waves was numerically simulated and compared with the experimental values, and then the calculation accuracy of the total hull resistance and the characteristics of the motion parameters under different wavelengths were studied. The results show that: overlapping grids have a higher hydrostatic resistance calculation accuracy than sliding grids, up to 5.2% when v=5.0 m/s. In the numerical calculation, the amplitude and average value of wave resistance are greater than the experimental value, and the error is the largest at the wavelength of 7.0 m. From the study of various wave motion parameters, it can be seen that there is no obvious difference between the duration curve of each motion parameter and the test value, and the calculated value of amplitude response is generally smaller than the experimental value, but the calculated value is obviously greater than the experimental value when λ/L is 2.33.
Accurate identification of traffic accident risk and timely mastering the change of traffic crash risk are of great significance for proactive prevention and reduction of traffic accident. Most of the existing traffic crash identification studies are based on real-time and dynamic parameters such as traffic flow and traffic conflict. The application of risky driving behavior in traffic accident risk detection is limited by the constraints of previous data acquisition technologies. To more accurately identify the risk of road traffic crashes, this study introduced risky driving behavior and traffic operating status and other big data, and extracted sharp acceleration, deceleration, turns, merge into other lane, traffic volume, average speed, and congestion index as variables. And traffic accident identification models were constructed based on accident data. The traffic accident identification model was evaluated based on the logistic regression algorithm. On the one hand, the contribution of risky driving behavior in traffic accident identification was quantified; on the other hand, the trend of traffic accident occurrence probability before and after the accident was analyzed. The results show that the sensitivity and AUC values of the traffic accident identification model considering both traffic operation state and risky driving behavior are increased by 5.00% and 0.03, respectively. The false alarm rate and missing report rate are decreased by 1.78% and 5.00%, respectively, which shows better fitting effect of the model. In addition, before and after the occurrence of traffic accidents, the risk probability of traffic crashes shows an obvious trend of rise, which is the key period of traffic accident prevention and control. The measures should be taken in corresponding sections in time to curb the rising trend of traffic crash risk and avoid the occurrence of traffic crashes. This study can provide intuitive basis for traffic accident prevention, and active prevention and control.
The operation and management optimization schemes of freeway always need to be formulated according to the traffic capacity of bottleneck sections. Due to the complexity of the traffic flow characteristics of the bottleneck sections of freeway, the current general calculation formulas of the traffic capacity are limited to many assumptions, and the accuracy is not high and the error is large. This paper attempted to construct a calculation method of traffic capacity in freeway bottleneck sections and verify it by actual measurement. Firstly, UAV technology and software Tracker were used for aerial video recording and dynamic identification and 680 groups of traffic flow data for car-following and lane-changing on freeway was obtained, including position, speed, acceleration, headway and other parameters. Then, the probability models and rule models of lane-changing considering driver characteristics were established according to the obtained traffic flow parameters, and the classical car-following model GHR was calibrated. Finally, a simulation application model of freeway traffic flow based on cellular automaton theory was constructed by the partitioning method, the acceleration requirements of following vehicles were characterized with GHR model, and the effectiveness of the model was verified by the indicators of vehicle lane-changing times and hourly traffic volume with error rates of 12.06% and 3.19%, respectively. The results show that this model can effectively calculate the capacity of freeway diverging and merging areas and design the road parameters such as the length of speed-change lane. In this case, a traffic flow simulation test was conducted on Cencun interchange sections of Guangzhou Northring Freeway, in which the road geometry characteristics, vehicle arrival conditions and traffic flow operation mechanism were simulated. The capacity of the diverging and merging areas is 5 456 and 5 253 pcu/h, respectively, and the optimization design values for the length of speed-change lanes in the diverging and merging areas are 125 and 200 m, respectively. The cellular automaton model of traffic flow constructed in this paper provides scientific basis for microscopic traffic flow simulation and road parameters design of freeway diverging and merging areas, and helps to improve the level of service and operational quality.
Cylindrical structures exist widely in nature and engineering. The problem of suppression of vortex-induced vibration of cylindrical structures caused by viscous flow separation has received close attention in past decades. Splitter plate is commonly used as a passive control device due to its effective suppression of vortex shedding, but it is worth of further research about its influence on the VIV of circular cylinder and internal mechanism of VIV suppression. Herein, combining with lift oscillator model and Detached Eddy Simulation turbulence model (DES) and adapting asynchronous iterative algorithm, numerical computation of strong coupling resolved method were carried out by using SIMPLE algorithm and Newmark-β method to solve the discrete fluid and structural equations. The accuracy of the strong coupling algorithm based on Detached Eddy Simulation was verified, and then the effect of suppression of splitter plate (L/D=0.5) on a cylinder with single degree of freedom vibration was studied when the range of reduced velocity was 0<U*<16.67. Moreover, the suppression effect of the splitter plate on the wake mode, responses of fluid force and vibration, and frequency characteristics of vibrating cylinder was analyzed. The critical velocity was obtained. The numerical results show that the vibration can be well suppressed when U*<10.The maximum vibration amplitude decreases about 69%, lock-in region of frequency becomes narrow and the vortex shedding frequency decreases obviously. The maximum fluid parameters CD,mean,CD,rmsand CL,rms, acting on the cylinder, decrease about 40%, 90% and 52% respectively. For cylinder attached a splitter plate, galloping phenomenon occurs as U*>10. The vibration amplitude of the cylinder keeps increasing. With the continuous increase of U*, the separating shear layer reattaches to the splitter plate again, and the cylinder absorbs energy from the flow, which was far greater than the energy consumed by structural damping. The amplitude conti-nues to increase and exceeded that of the smooth cylinder, so the vibration of the cylinder is more severe and vibration of cylinder cannot be suppressed by splitter plate in this region.
With the continuous advancement and popularization of autonomous driving technology, more and more vehicles with autonomous driving technology will appear on the road, and the service objects of road markings will gradually transition from drivers to autonomous vehicles.On the one hand, the method of road markings condition assessment requires a lot of manpower to inspect, measure and evaluate; on the other hand, the evaluation index is based on biological vision research, which does not conform to the characteristics of automatic driving vehicles based on machine vision. To solve the above problems, this paper proposed a method of road markings condition assessment for autonomous vehicles. First, PSNR(peak signal-to-noise ratio) was initially determined as the evaluation index by means of literature review, analogical reasoning and logical reasoning. Secondly, to quickly obtain PSNR, this paper proposes a calculation method of the PSNR based on image inpainting, which utilizes the DeblurGAN model restores the damaged road markings at the image level, and then uses the damaged and restored road markings images to calculate the PSNR. In addition, this paper proposed a data augmentation method that can realis-tically synthesize damaged road markings images to improve the performance of image inpainting models. Then, the AlexNet network was used as the benchmark model to design experiments to study the relationship between the PSNR and the recognition accuracy of road markings. The experimental results show that, compared with the calculation method of the PSNR based on the artificially restored image, the average PSNR obtained by the method proposed in this paper only differs by about 2.24%, but the acquisition speed is increased by about 418 times; when the average PSNR differs by about 43.66%, the average recognition accuracy differs by about 36.27%. Therefore, the PSNR can measure the use of road markings. Compared with the evaluation method of the current standard, the evaluation method proposed in this paper improves the work efficiency by about 6.5 times and consumes less manpower. And it is more in line with the characteristics of self-driving cars, but the evaluation methods are more detailed in the specification.
To solve the safety problem of collision between a high-speed intelligent vehicle and a low-speed vehicle on the superhighway, the vehicle braking collision avoidance system was studied by using the method of co-simulation. CarSim was used to establish the vehicle dynamics model and set the front vehicle parameters, road parameters and sensor parameters, and the control model based on vehicle distance and speed was established in MATLAB/Simulink. The signal connection is established through the input and output parameter interface module of CarSim software. When the speed of the front car is 100, 120 and 140 km/h, and the speed of an intelligent vehicle is 140, 160 and 180 km/h, respectively, the control model sends the braking deceleration signal to the intelligent vehicle through the real-time distance and speed collected by the sensor and establishes the emergency braking collision avoidance strategy for the vehicle on the superhighway. The results show that when the road adhesion coefficient is 0.60 and the car is braked on the flat straight section of the superhighway, the optimal wheel cylinder pressure is 7 MPa, and at this time, the braking distance of the car is 170.3 m at a speed of 160 km/h. The front car travels at a speed of 100, 120 and 140 km/h, and the smart car brakes at 140, 160 and 180 km/h, respectively, to the same speed as the car in front, requiring relative distances of 10.8, 10.7 and 10.5 m, respectively. When the road adhesion coefficient is 0.60, the vehicle speed of the front vehicle is 100, 120 and 140 km/h, respectively. When the initial cylinder pressure is 1 MPa and the intelligent vehicle braking decelerates to the same speed as the front vehicle, the distance between the front suspension of an intelligent vehicle and the rear suspension of the vehicle in front is 3.1, 3.5, and 3.8 m, respectively. When the initial cylinder pressure is 3 MPa and the intelligent vehicle braking decelerates to the same speed as the front vehicle, the distance between the front suspension of an intelligent vehicle and the rear suspension of the vehicle in front is 7.0, 7.3, and 7.7 m, respectively. Through the CarSim/Simulink co-simulation platform of vehicle emergency braking and collision avoidance control, the validity and accuracy of superhighway braking and collision avoidance model are verified, which can improve the safety of superhighway driving.
The traditional driving behavior model framework divides the driving behaviors into car-following and lane-changing, which are modeled separately. While the integrated driving behavior model framework believes that car-following and lane-changing are inseparable, so all driving behaviors are modeled as a whole. Based on these two behavioral model frameworks, this paper analyzed the performance of the data-driven human-like driving models. Firstly, it established integrated driving behavior model framework and car-following lane-changing combined model framework and then determined the input and output of the models according to the influencing factors in driving. Secondly, two combinations of car-following, lane-changing and intention recognition modules were proposed: discriminative combination and probability combination. Subsequently, the processing of the original data were carried out to build integrated driving behavior, car-following, lane-changing, and intention recognition datasets, which were used to train and calibrate the corresponding modules. Finally, the study compared the performance of the two combination models with the integrated driving behavior model in various aspects, including model accuracy, safety, robustness and migration. The results show that, when the model input and output, the parameter calibration process and the dataset are the same, the accuracy of the human-like driving model based on long short-term memory neural network (LSTM) is better than the model based on FNN. The mean square error of the model based on LSTM can reach 0.227 m2, and the mean square error of the model based on FNN is 0.470 m2. Within the LSTM-based model, the model using the car-following lane-changing combined model framework has better robustness and transferability than the model using the integrated driving behavior model framework. For the car-following lane-changing combined model, the mean square error of ±10% noise robustness can reach 1.383 m2, and the mean square error of transferability can reach 0.462 m2. For the integrated driving behavior model, the mean square error of ±10% noise robustness is 2.314 m2, and the mean square error of transferability is 0.484 m2.
When there is a saturated intersection on the arterial road, it is necessary to intercept and regulate the traffic flow in the entry direction of the saturated intersection, so as to avoid the overflow of the section queue, and to conduct green wave dredging in the exit direction of the saturated intersection to facilitate the rapid departure of traffic flow. According to the coordination control requirements in different directions of saturated intersection, this paper proposed an algebraic method of coordination design for bi-directional red and green waves on arterial roads. Firstly, the general formula for calculating the ideal intersection distance was derived by using the time-space diagram, and the calculation method of bias-split for the coordinated phase was given. Secondly, for different common signal cycles, the bias-split for the coordinated phase under different signal phase modes of each intersection was calculated respectively. The signal phase mode corresponding to the bias-split with the smallest absolute value was taken as the preferred phase of each intersection. Then, the max difference of bias-split corresponding to the preferred phase under different common signal cycles was compared, and the common signal cycle with the minimum of the max difference of bias-split was selected as the best common signal cycle. Finally, based on the characteristics of red and green waves, the optimization method of fine-tuning signal offsets was given to minimize the bias-split of the green wave direction, so as to ensure that the arterial road can obtain bi-directional red and green wave bandwidth as wider as possible. The case analysis shows that, compared with the scheme of bi-directional green wave coordinated control, the bi-directional red and green waves coordinated control scheme designed by this method can significantly increase the green wave bandwidth in the direction of leaving the saturated intersection while ensuring that there is a maximum red wave bandwidth in the direction of entering the saturated intersection. The VISSIM simulation experiment shows that the scheme designed by this method can not only shorten the maximum queue length by 23.1% and the average queue length by 33.8%, and delay the time of vehicles queuing to overflow to the upstream intersection, but also reduce the travel time and the number of stops of the vehicles leaving at the saturated intersection in the downstream section by 17.5% and 76.3%, respectively. It can realize the overflow prevention and green wave dredging of the saturated intersection.
Transient pressure is one of the important factors affecting the structural safety of the lining of a high-speed railway tunnel. To further understand the characteristics of transient pressure and pressure gradient of a high-speed railway tunnel wall, a numerical simulation model for a high-speed train composed of eight cars with a scale of 1∶1 was established to investigate the aerodynamic characteristics induced by a high-speed train travelling through a double-track tunnel, based on the RNG k-ε two-equation turbulence model and the sliding mesh technique. The accuracy of the numerical method was verified by comparing the numerical simulation results with the field measurement. The influences of train speed, blockage ratio of train-tunnel, the number of trains, and two trains intersecting with the same speed on the transient pressure and pressure gradient on tunnel longitudinal middle section were further studied based on the analysis of the temporal-spatial traits of transient pressure on the tunnel wall. The results show that, the time-history curves of transient pressure in the tunnel cross-section are nearly overlapped, the pressure distribution in the cross-section is uniform, and the difference is low. Three typical pressure peak values (maximum positive peak value, negative peak value, and peak-to-peak value) show a linear relationship with the square of train speed or the square of blockage ratio, the positive peak value of the initial pressure gradient has a linear relationship with the third power of the train speed, the positive and negative peak values of pressure gradient have a linear relationship with the power of the blockage ratio (2.51~3.14). The relationship between the three typical pressure peaks and the number of trains satisfied an exponential function, the maximum positive peak value of pressure gradient of 8 trains is 1.25 times that of other cases (4~7 trains). The maximum positive and negative pressure peak values of the two trains intersecting with the same speed are 2.22 times and 1.15 times that of the single train passing by, respectively, and the maximum positive and negative peak values of pressure gradient of the two trains intersecting with the same speed are 1.87 times and 2.03 times that of the single train passing by, respectively. The relevant research results have important reference values for the safe operation of a high-speed train in tunnel.
With the increase of residents’ travel demand, there are higher requirements for bus operation efficiency and service quality. But bus operation companies usually adopt single-line scheduling, which often leads to the mismatch between passenger flow and transport capacity input, low bus service level, and resource utilization inefficiency. A more efficient scheduling optimization method is urgently needed. In the combined scheduling mode, manpower and vehicles are shared among multiple lines, which helps to integrate the existing bus resources and improve the matching degree of supply and demand of transport capacity and bus operation efficiency. In this paper, the identification rules of the cross-line scheduling line group and the determination method of the number of cross-line vehicles were proposed based on the characteristics of passenger flow. The optimization goal was to minimize the sum of passenger travel costs and bus operating costs, and an optimization model of bus cross-line combined scheduling with cross-line vehicles was constructed. The departure type and departure interval was encoded and it was solved by an improved genetic algorithm. The lines No.668 and No.122 in Beijing were selected as the case of cross-line combination scheduling, and the average waiting time of passengers, line load factor, capacity matching degree, passenger flow intensity and other indicators were introduced to evaluate the effectiveness of the optimization model. The results show that, under the condition of bus cross-line scheduling, the average waiting time of passengers on the supported bus lines is shortened by 11.8%; the line load factor is reduced by 9.8%; the capacity matching degree and passenger flow intensity are increased by 7.7% and 8.7%, respectively; passenger travel costs and bus operating costs are reduced by 15% and 6%, respectively.
In order to explore the influence of the highway roadside environment on the driver’s attention,optimize the roadside landscape and traffic sign settings,and improve the driving safety,this study determined the roadside environment risk level interval by quantitatively analyzing the driver’s attention distribution. Four types of typical scene were selected according to the actual state of the roadside environment, and field driving tests were carried out to collect data such as driver’s eye movement parameters and heart rate. The driver’s eye movement on the corresponding road section was analyzed,including fixation behavior,scan behavior and blinking behavior. On this basis,the obvious eye movement index that characterizes the driver’s attention was determined as the fixation parameter. According to the actual scene corresponding to the driver’s fixation point and the position of the point in the visual field, the driver's visual field area was divided into three parts, namely the roadside area (S area),the way area (W area) and the car area (C area). By constructing the driver’s attention distribution model,the roadside environment was quantified and expressed by the ratio of attention region. The relationship model between the ratio of attention region and the driver’s heart rate growth rate was established,and the risk level interval was divided. The results show that the complexity of the roadside environment has a significant impact on the driver’s eye movement behavior. Compared with scan and blink,the driver’s fixation parameter can significantly characterize the driver’s attention state. When driving on the road,the driver’s fixation point moves in the view field,the ratio of attention region is the ratio of cumulative fixation time in the S area and the total fixation time of the S area and the W area. Its safety interval is [9.93%,62.10%],the risk interval is [6.44%,9.93%) and (62.10%,76.93%],and the danger interval is [0,6.44%) and (76.93%,100%]. This research can provide a reference for the safety evaluation and decision-making of roadside landscape improvement.
Under the background of dual-carbon policy, it is imperative to maintain ecological balance and reduce carbon emissions. Nowadays, it is very important to accurately measure the carbon emission index of vehicles on a wide range of road networks. Therefore, this study proposed a measuring method of vehicle carbon emission in expressway network based on multi-source data fusion. Firstly, a basic data cleaning method for carbon emission statistics was proposed to clean the basic data required for subsequent carbon emission calculation. Secondly, the highway carbon emission calculation model was established, and then the related calculation process was designed. Finally, taking the whole highway network of Guangdong province as an example, this paper calculated the vehicle carbon emission from September 2020 to June 2021, and compared the calculation results with China’s carbon accounting database.Through this method, the proposed method was proved to be scientific and reliable. The research shows that the average carbon emission of mini buses in Guangdong province is small, but the total carbon emission accounts for the largest proportion of all types of vehicles, up to 52.1%; the total carbon emission of gasoline vehicles accounts for 49.8%, which is higher than that of diesel vehicles (45.4%) and of other energy vehicles (4.8%). Vigorously promoting new energy vehicles can effectively reduce the carbon emission of expressways. In addition, the study finds that there are significant differences in the travel patterns of different vehicles under COVID-19, but the overall impact on the transportation economy is limited.
In order to alleviate the parking difficulty, make more balanced use of parking resources and realize the dynamic response to parking demands, this study established an integer programming model for dynamic reservation and allocation of shared parking slots in multiple parking lots by taking several adjacent off-street parking lots as the research object. Aiming at making full use of parking resources and saving users’ parking costs, the model adopts linear weighting to combine the goals and adaptively selects dynamic weight coefficients according to the real-time number of parking requests. The allocation results were optimized iteratively by adjusting the parking requests from the car that does not arrive. In addition, dynamic pricing mechanism was introduced to balance the utilization of each parking lot. The model was evaluated by four indicators: parking space utilization rate, parking request acceptance rate, average walking distance and equilibrium degree of parking area. the model was verified by simulation experiments. The results show that, compared with the traditional unadjusted model, the proposed model can increase the utilization and acceptance rates by 10.70% and 20.08%, respectively, on average by iteratively optimizing the unreached parking requests. The improvement degree of utilization increases first and then decreases with the number of parking requests. The average walking distance of users increases by about 10m, but it still meets the travel needs of users. Compared with the static weight model, the utilization rate and acceptance rate of the embedded dynamic weight model are increased by 2.2% and 10.88%, respectively. The dynamic weight model can better adapt to the dynamic changes of parking demand, so that parking resources can be fully utilized during peak hours. Compared with the static pricing model, the dynamic pricing mechanism was introduced to evenly distribute vehicles to each parking lot, and the equilibrium degree of parking area is reduced by 0.074 on average, so as to realize the balanced utilization of parking resources. The model can provide theoretical reference for parking allocation and management decision-making of shared parking platform and alleviate the problem of urban parking.
 2022 Transportation Engineering
